

Representation
We believe we must measure that which we want to improve. By measuring representation across a variety of identity factors and intersections, we can identify areas of opportunity and work to improve them at all levels across the organization. These changes in representation may not happen quickly, but we are committed to ensuring that all of our employees see people like them across the organization and within leadership.
≤ð¡Ò…Á«¯ has grown significantly in the last year. In addition to organic growth, in 2021, we acquired great companies, including Healthgrades and PlateJoy, resulting in our non-telesales U.S. employee population increasing by 23%.
The growth in our U.S. employee base extends to our leadership teams. Our population of leaders at the director and above level grew by 55% in 2021. Over the last year, the representation of women in leadership has increased by 15%. Our BILAP representation in leadership has remained relatively flat.

Representation in Telesales
Telesales represents 8% of ≤ð¡Ò…Á«¯' employee population in the U.S. and has a significantly different demographic makeup. The telesales organization is made up of 55% women, 44% men, 1% non-binary, 33% white employees, 47% Black employees, 13% Latino(a) or Hispanic employees, and 7% other racial identities.
Gender Identity Representation
As of April 2022, we’re pacing 9% ahead of our representation of women across the organization in 2021.

Race & Ethnicity Representation

Representation of BILAP employees increased 6% YoY, primarily driven by growth in our Asian and Black employee populations.
Representation of our Black employees increased by 13% between 2021 and 2022. Black employees now make up 9% of our organization, compared to 8% last year.
Representation of Asian employees increased by 11% between 2021 and 2022. Asian employees now make up 10% of our organization, compared to 9% last year.
Representation of all other racial groups remained unchanged YoY.

Gender Identity Representation
in Leadership
Not only are we seeing an overall increase in the representation of women, but the representation of women in leadership increased 15%. However, there is no non-binary representation at the leadership level.

Race and Ethnicity Representation
in Leadership (Director+)
BILAP representation in leadership increased 16% YoY driven by gains in Asian and Black employee populations.
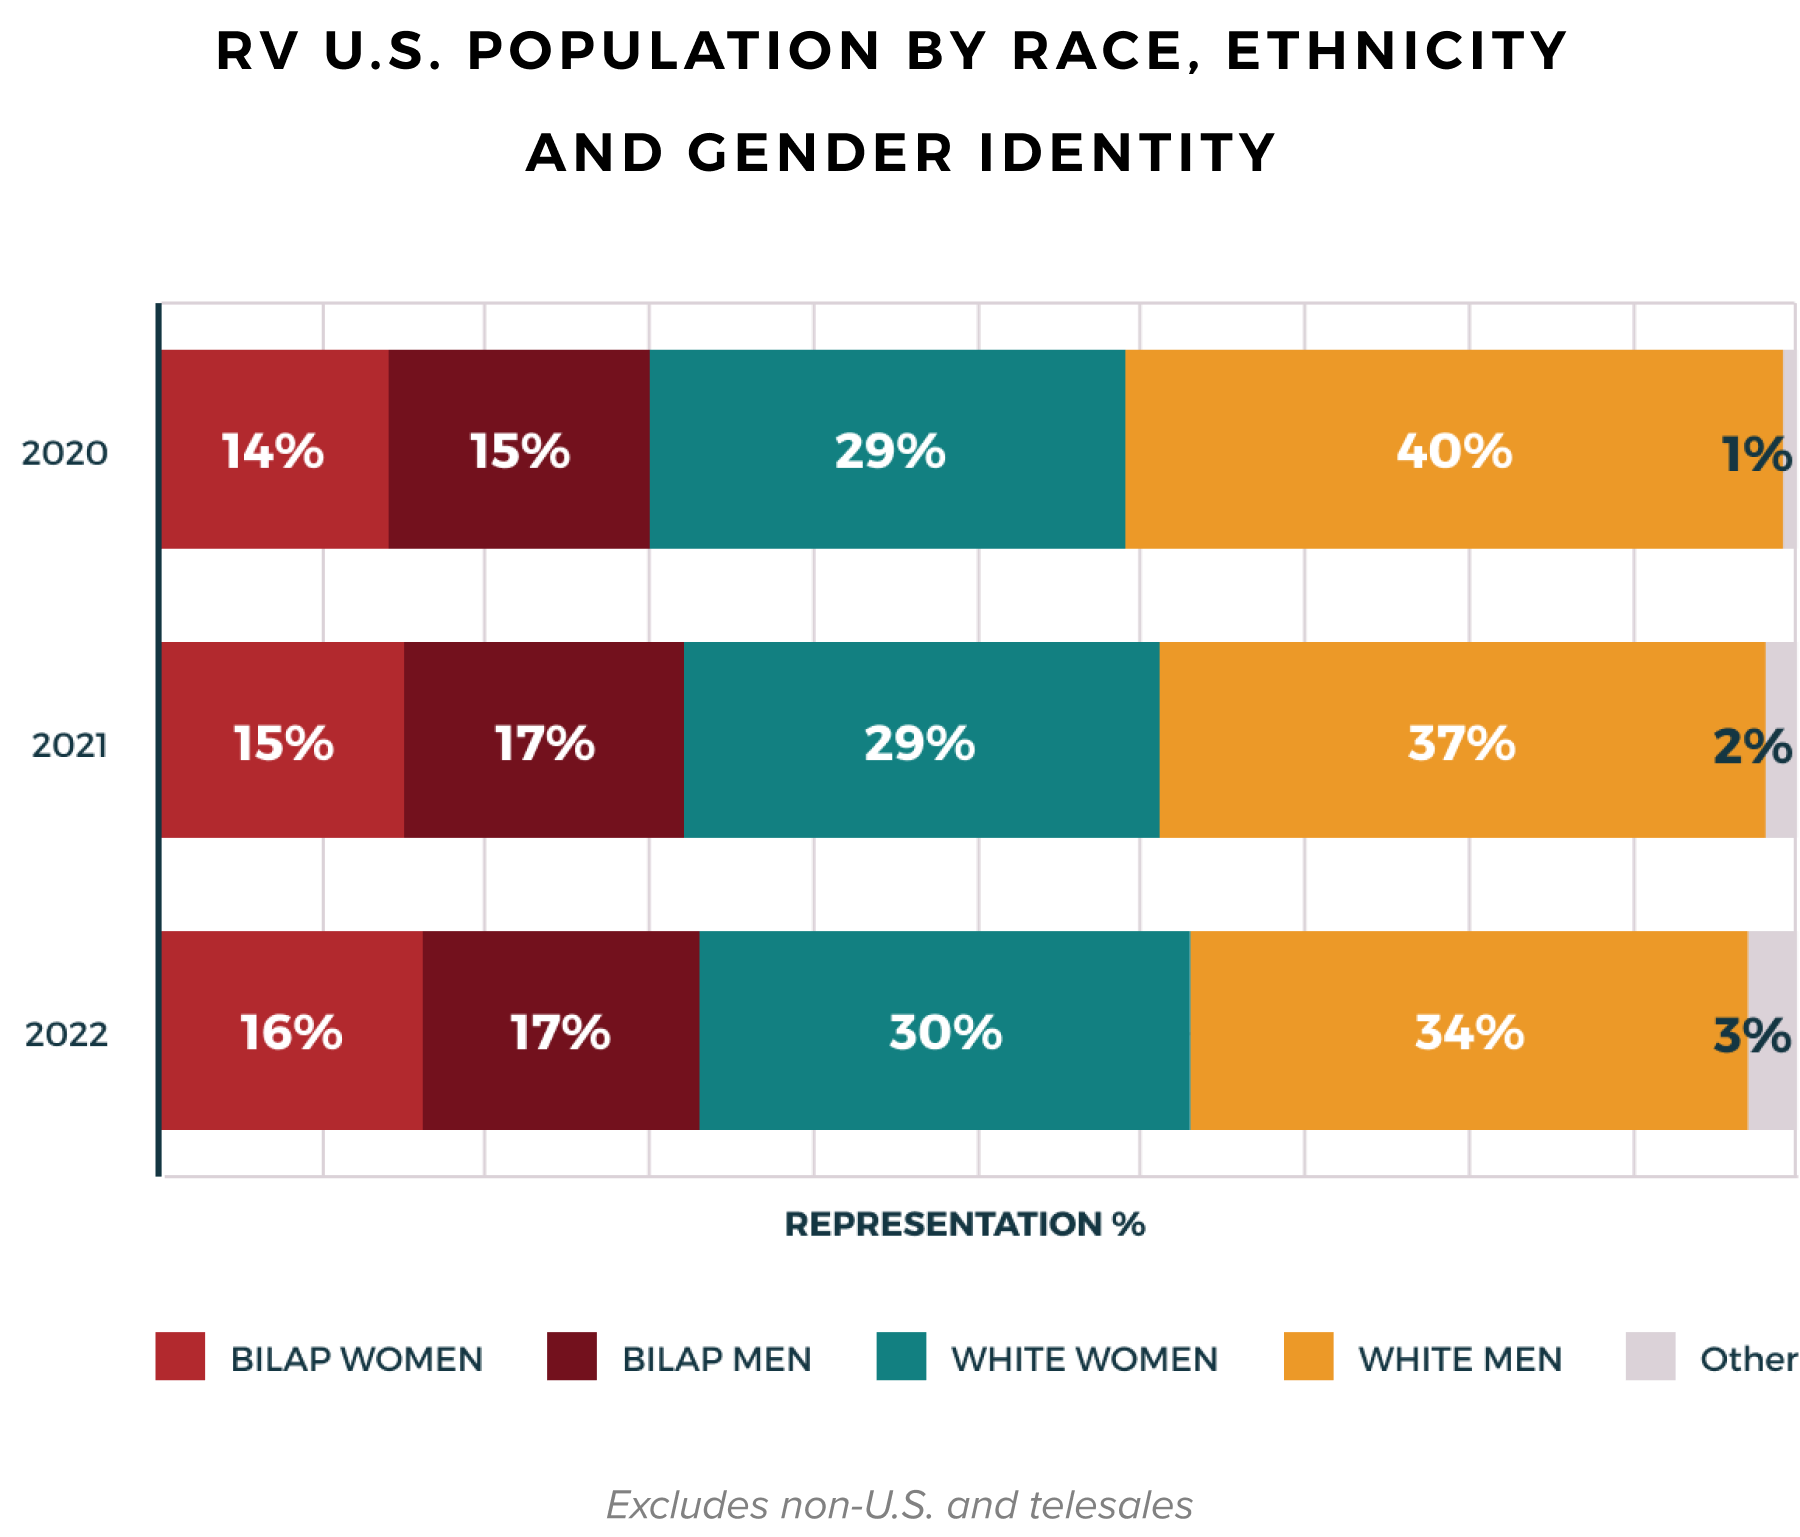
The Intersection of Race, Ethnicity, and Gender Identity Representation
At the intersection of race, ethnicity, and gender identity, the representation of BILAP women increased 7% YoY.

The Intersection of Race, Ethnicity, and Gender Identity Representation in Leadership (Director+)
Despite the overall growth in our leadership team, we must continue to work toward increasing BILAP representation at the director and above level.
LGBTQ+ Representation
The LGBTQ+ community makes up about 5.9% of the U.S. workforce. At ≤ð¡Ò…Á«¯, 5% of our U.S. employee base identifies as LGBTQ+. Of our leaders, 2% fall within this community. Although our LGBTQ+ employee base is comparable to the U.S. workforce, we will continue to make strides in creating an LGBTQ+ inclusive workforce by leveraging partnerships such as Out in Tech to support the recruiting and development of LGBTQ+ talent.
Talent Pipeline Representation
Our overall representation is driven by diversifying our incoming talent pipelines of experienced talent (new hires) or those who recently graduated from college (university hires).
New Hire Representation
by Gender Identity
The representation of women in our new hire employee base is pacing 9% higher YoY. Moreover, the representation of women among new hires was 23% higher than our current employee base.

University Hire Representation by Gender Identity
The representation of women among our university hires increased 34% YoY. While we've begun recruiting and hiring 2022 grads, they will start later this fall and be included in next year's report.


New Hire Representation by Race and Ethnicity
The representation of BILAP employees in our new hire employee base increased 12% between 2020 and 2021. Moreover, the representation of those who identify as BILAP was 41% higher than our current employee base in 2021. As of April 2022, our new hire representation is underpacing 2021 by 19%.

University Hire Representation by Race and Ethnicity
The representation of BILAP employees among our university hires increased 44% YoY, driven by gains in the representation of those who identify as Asian or Black.
Attrition
Despite rises in attrition rates in Q1 of 2022, overall attrition remains below pre-pandemic levels. Moreover, we've reduced the BILAP attrition rate from 8% to 5%, which is now in line with the 5% attrition rate among white employees. However, we understand that maintaining this improvement beyond the pandemic will be the best indicator of change within the organization. As we continue to learn and establish our hybrid working model, the work our teams are doing to drive inclusion and belonging is more important now than ever, and our people continue to be our priority.


// DEI REPORT 2022
Chapter 1: Inclusion & Belonging
// DEI REPORT 2022
Introduction


// DEI REPORT 2022
Chapter 4: Being the Change
// DEI REPORT 2022
Chapter 5: Future Forward


// DEI REPORT 2022
Chapter 3: Representation
// DEI REPORT 2022
Chapter 2: Equity