

DIVERSITY
2023-2024 DEI Annual Progress Report
Introduction
The world has changed quite a bit since we first introduced our annual Diversity, Equity and Inclusion (DEI) report in 2020 - but the data remains clear:
At ≤ð¡Ò…Á«¯, our DEI strategy has also evolved over time - but our commitment to leveling the playing field, maintaining diverse pipelines, and educating employees remains the same.
Defining Our Pillars
We’ve updated some of the language we use to outline our DEI strategy and reporting. Here’s how this maps to the terms we’ve used in previous progress reports.
INCLUSION ‚Üí BELONGING
Cohesion drives results. Beyond simply creating an inclusive environment, we strive to build a community where employees of all backgrounds feel a deeper sense of connectedness, acceptance, and value, and can produce their best work together.
REPRESENTATION
Our terminology for representation will remain unchanged. In order to continue building a diverse, engaged, and connected community, we must first understand the makeup of our employee population and trends across different demographics.
EQUITY ‚Üí OPPORTUNITY
At ≤ð¡Ò…Á«¯ we want to level the playing field for our employees. While equity focuses on fairness and addressing disparities, opportunity emphasizes providing all individuals with the avenues to achieve their full potential.
Measuring Progress

Over the last four years, we’ve launched and refined our Employee Resource Group strategy, expanded mentorship programs and internal accelerators, diversified our talent pipelines, increased visibility into the lived experiences of our teammates across all identities, and expanded our benefits and workplace protections - earning a perfect 100 percent score from the 2023-2024 Human Rights Campaign Corporate Equality Index.
However, progress is not always linear, and we know that we must continuously measure what we want to improve. We invite you to explore the report ahead, which provides an overview of our 2023-2024 initiatives, metrics, and outcomes.
As always, our goal is not to be perfect, but to get better every day. By the end of this report, we hope you have a clear sense of the momentum we’ve gained so far, as well as opportunities we’re focused on ahead.

About This Report
Expand each question below for details about how this report was created.
-
This report enables us to track year-over-year company-wide trends, hold ourselves accountable to our efforts and impacts, and share our progress with our employees, partners, and communities. While this report will only cover org-wide data, HR representatives review our data at a team-wide level to inform leaders on more specific areas of progress and opportunity.
-
Many teams contributed to this resource, including Human Resources, Central Culture, Central Talent & People Data, Legal, and our DEI Advisory Board - a group of employees representing varying backgrounds, roles, and tenures who provide counsel and feedback on diversity-focused topics and projects like this one.
-
Our Annual DEI Progress Report data is collected using our HR records and analyzed in conjunction with employee sentiments, gathered through routine internal surveys. The data shown below was measured between September 2023 - September 2024.
-
The report measures employee representation and sentiment data from all full-time and part-time permanent employees supporting our US-based businesses.
Representation Language Guide
As you continue reading, you’ll spot a few of the phrases below. Here’s how we define them.
BILAP | Black & African American, Indigenous, Latine/Hispanic, Asian, Pacific Islander
Other | Employees who identify as an ethnic group with <1% representation or have not specified their race/ethnicity in their HR records
Leadership | ≤ð¡Ò…Á«¯ employees at the director level or above
New Hire | A new hire who entered ≤ð¡Ò…Á«¯ through the typical recruiting process
University Hire | A new hire who entered ≤ð¡Ò…Á«¯ via the LAUNCH program for new college graduates or the Road to Hire apprenticeship program
Report Summary

Though we continue to view this as a long-term journey, we are proud to see momentum building as a result of focused efforts to-date. This year, we achieved a 100% score on the Human Rights Campaign (HRC) Corporate Equality Index for outstanding efforts in promoting LGBTQ+ equality in the workplace.
Additionally, we rolled out our new People Health Report, which synthesizes data from a variety of HR and Central Talent sources to provide leaders with increased visibility into their team’s representation and employee sentiment data. We look forward to exploring how this tool can support our DEI efforts in the future.

In 2024, 80% of ≤ð¡Ò…Á«¯ employees expressed favorability with the statement, ‚ÄúI feel like I belong at ≤ð¡Ò…Á«¯‚Äù - a datapoint that jumped nearly 20% YoY. Additionally, BILAP attrition steadily decreased and has now dropped lower than our org-wide attrition rate. In other words, employees feel like they belong here, and are increasingly choosing to stay.
At a high level, representation data was mostly flat from 2023-2024. We saw positive momentum this year in terms of representation of women overall, however, this metric continued to decline within our new hire and university hire representation. Representation data continues to show opportunities for improvement in hiring and retaining BILAP talent, increasing representation of women at the senior level, and continuing to diversify our college talent pipeline.
≤ð¡Ò…Á«¯ Today
To read this report with the full context of our current organizational demographics, here is a high-level breakdown of our representation. (For a deeper dive into representation data, scroll down.)

Belonging
OUR STRATEGY
At ≤ð¡Ò…Á«¯, we believe that teammates who feel supported, engaged, and able to be themselves at work are more likely to contribute new ideas, drive performance and productivity, and enhance our company culture.
Our approach to fostering an environment where every person feels that they belong centers on building strong communities within our organization.

At the Organizational Level
Our Employee Resource Groups (ERGs) provide community spaces for ≤ð¡Ò…Á«¯ers to connect and advocate for the interests of underrepresented groups within our organization.
These groups receive central corporate support to better enable them to provide regular programming, events, and learning opportunities throughout the year.


Community Driven Efforts
Beyond our ERGs, many employees choose to lead and participate in their own grassroots programs & spaces - some with just a simple Slack channel; others with coordinated events and activities. All of these efforts aim to foster inclusive community spaces and aid in the connection and development of teammates near and far.
Belonging
OUR PROGRESS
Throughout the year, we survey employees on a number of topics to better understand and improve their workplace experiences. To ensure we‚Äôre creating a culture of inclusion and support, we look specifically at responses to the statement, ‚ÄúI feel like I belong at ≤ð¡Ò…Á«¯.‚Äù

In 2024, 80% of the organization responded favorably to this statement - an increase of 13 points from the previous year. This is a huge improvement and signals that our community-building efforts are driving positive impacts.

Belonging Data
by Race & Ethnicity
Once again, favorability remained fairly consistent across racial/ethnic backgrounds, with Latine/Hispanic teammates expressing the greatest favorability overall.
Belonging Data
by Gender Identity

Favorability remained fairly consistent across gender identities, with a slightly more positive response from male respondents.
Belonging Data
by Race & Gender Identity

Though some populations expressed similar favorability rates across gender identities (like our Latine/Hispanic population), other populations displayed a wider gap in their belonging favorability, with Asian men and women expressing the widest response gap. There is an opportunity to further understand the disparity here, and how we can better ensure employees of all backgrounds feel like they belong.
Representation
OUR STRATEGY
Changes in representation take time, but we are committed to nurturing an environment where all employees see their identities reflected throughout the organization, including leadership positions.
Our approach includes diversifying our interview slates, providing anti-bias training for interviewers, and retaining diverse talent by increasing leaders’ visibility into team-wide and organization-wide representation data.

Sourcing Diverse Talent

In 2024, we expanded the schools our recruiters visit for early career hiring, which include several HBCUs within close proximity to our Charlotte, NC headquarters.

We share bias prevention training with all employees participating in our candidate interview cycles, to better enable them to provide fair, unbiased assessments of potential incoming talent.

We continued our position as a corporate partner of Road to Hire - helping us diversify our own talent pool, and helping interrupt the cycle of intergenerational poverty in our community.
Retaining Diverse Talent

In 2024, we launched a “People Health Scorecard” - an automated monthly report for senior leaders, providing a detailed view of talent representation trends at the team and organization level.
The report synthesizes data from a number of sources - including hiring and attrition data, existing representation data, employee surveys and sentiment data, and beyond - to develop one holistic “snapshot” of each team’s population. It also uses these data points to create AI-generated forecasting for future trend lines.
The scorecard is one of our most exciting People Operations developments to-date and has the potential to serve as a key resource on our DEI journey.
Representation
OUR PROGRESS
At a high level, representation data was mostly flat from 2023-2024, with small shifts across each population.
We saw positive momentum this year in terms of representation of women overall, representation of BILAP women, representation of white women, and representation of women in leadership.
Despite generally positive shifts in representation of women, this metric continued to decline within our new hire and university hire representation.
In 2024, BILAP attrition steadily decreased and has now dropped lower than our org-wide attrition rate.
The data continues to show opportunities for improvement in hiring and retaining BILAP talent, increasing representation of women at the senior level, and continuing to diversify our college talent pipeline.
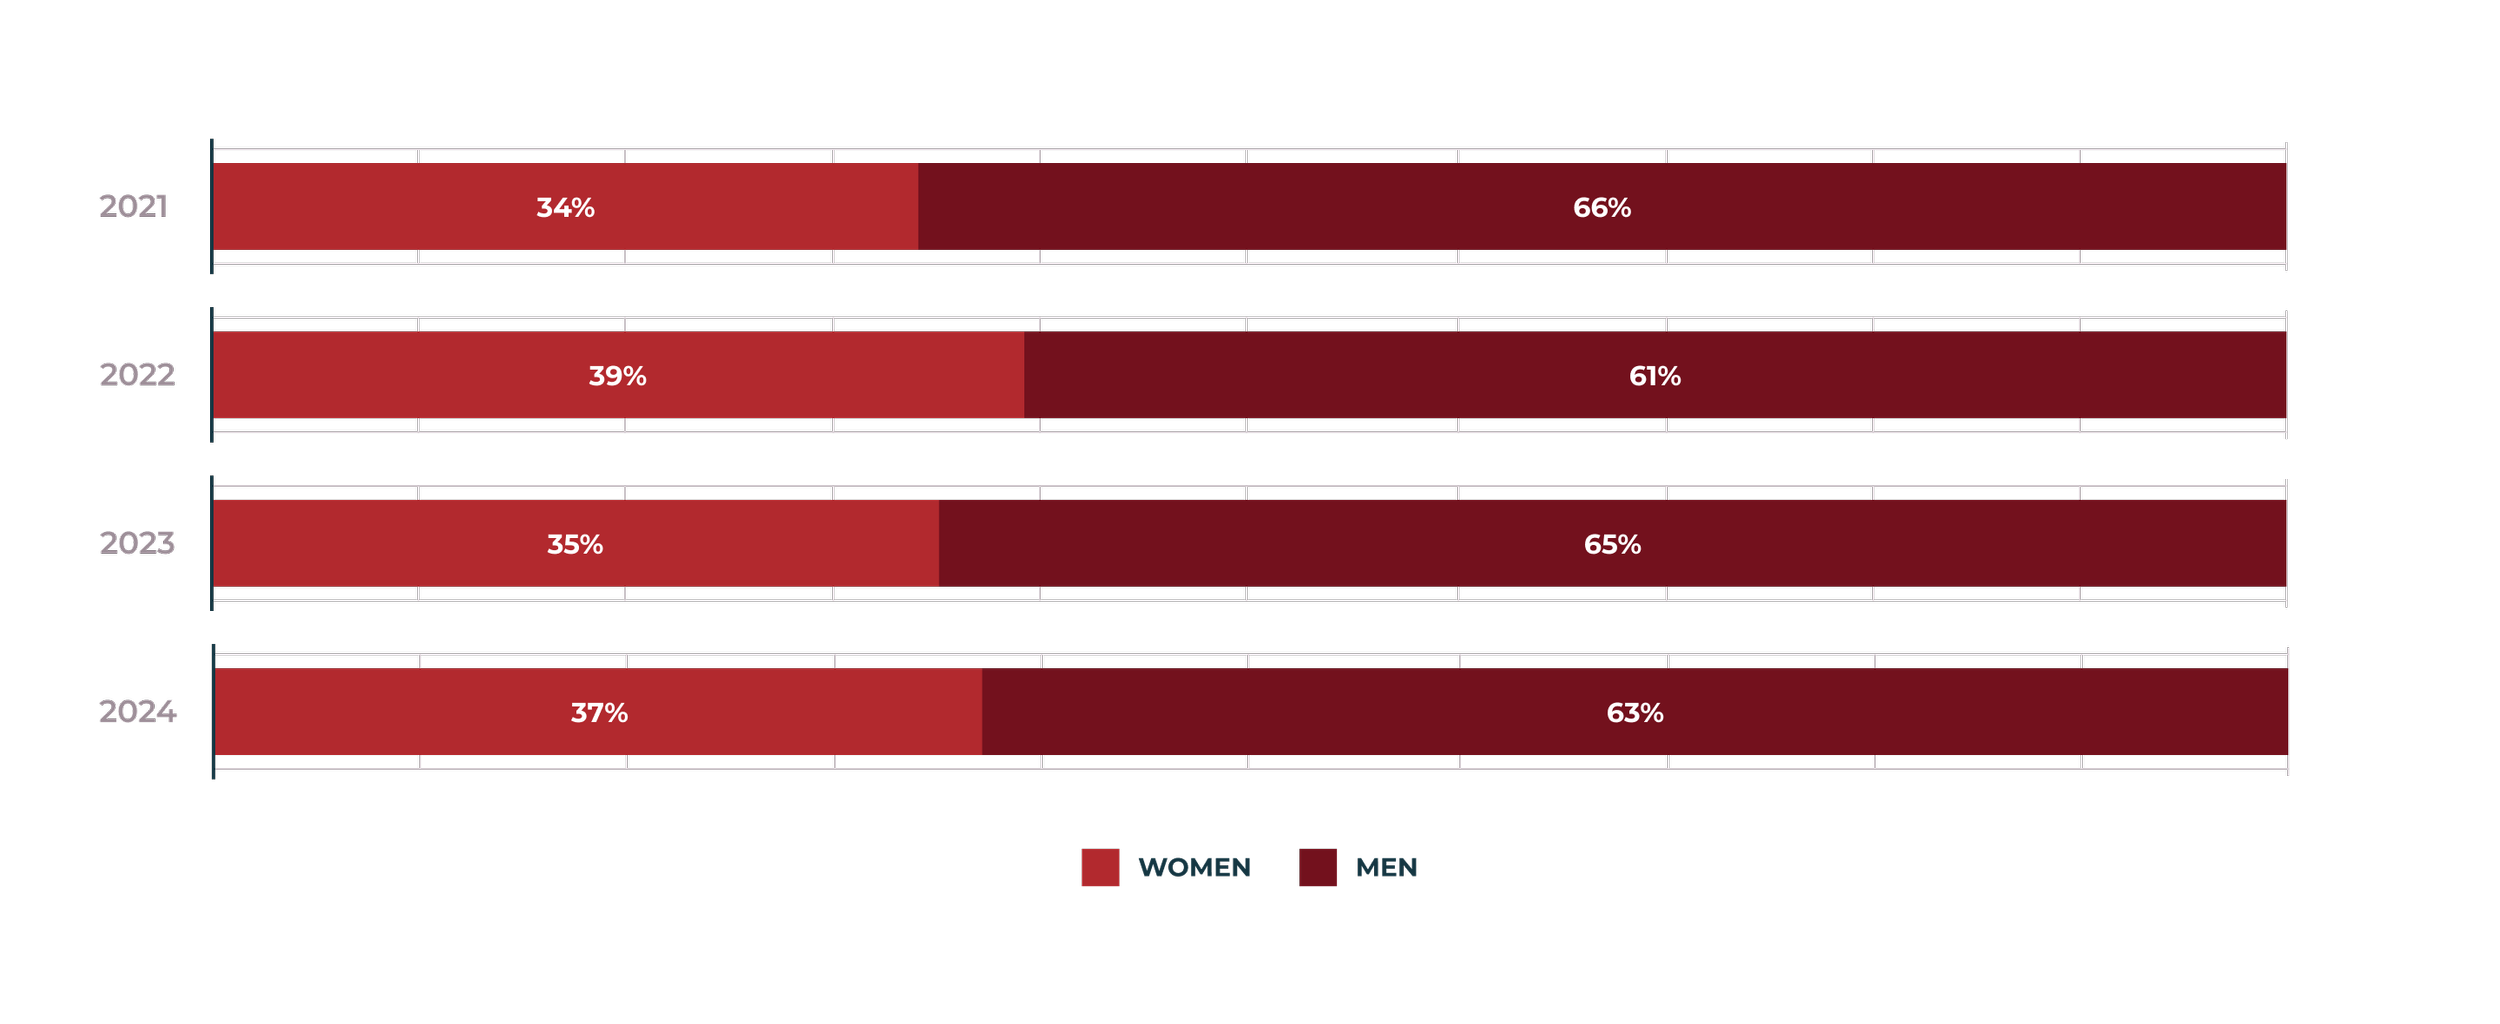
Gender Identity
Representation

As of September 2024, the representation of women across our organization increased by 2 percentage points, representing a 4% increase YoY.
This small shift denotes a positive trend towards more balanced gender representation, reflective of the broader global population - however, the data continues to show opportunity for improvement.
Gender Identity
Representation in Leadership
Representation of women in leadership is nearly 6% greater year-over-year (YoY); however, it remains 5% lower than our greatest measurement to-date in 2022 (39%).
While this increase is positive, our leadership representation continues to lag behind our broader org-wide gender identity representation data, particularly at the Executive Leadership level.
Race & Ethnicity
Representation

Overall representation of BILAP employees increased slightly YoY, with small shifts occurring across each unique population. While representation of Asian and Black employees decreased, representation of Latine/Hispanic employees increased.
Race & Ethnicity
Representation in Leadership

BILAP representation in leadership increased 1% (and 1 percentage point) YoY.
Representation across our Asian and Black/African American leadership decreased while representation across our Hispanic leaders increased.
The Intersection of
Race, Ethnicity, and Gender Representation

At the intersection of race, ethnicity, and gender, representation of BILAP women increased 13% YoY. Representation of BILAP men decreased 5% YoY.
The Intersection of
Race, Ethnicity, and Gender Representation in Leadership

While representation of white women in leadership decreased 7%, representation of BILAP women in leadership increased 3 percentage points (43%) YoY and has more than doubled (150%) since 2021. However, our total representation of BILAP women in leadership - while improved - remains small.
Representation of BILAP men in leadership decreased by 8% YoY, putting representation back to its 2021 percentage. There is an opportunity for better understanding as to why representation for BILAP men in leadership has stagnated while representation for BILAP women in leadership continues to grow.
Leading By Example
Though our representation numbers shift across our businesses, our Education and Lonely Planet teams have both achieved excellent ratios across leadership representation. On our Education business in particular, women and BILAP representation accounts for 50% of both the workforce and the leadership team. These teams provide an excellent opportunity for us to further examine the factors that have enabled them to develop such a diversified employee base.

LGBTQ+ Representation

At ≤ð¡Ò…Á«¯, the LGBTQ+ community makes up 6% of our U.S. employee base - up by 20% YoY. Of our leaders, 3% identify as LGBTQ+.
Note: Employees may choose to self-identify if they are members of the LGBTQ+ community in their HR records, and are not required to disclose this information or identify their specific sexual orientation. Data related to sexual orientation is only used for reporting purposes, in aggregate, and never tied back to an individual employee.
Talent Pipeline Representation
Our overall representation is driven by diversifying incoming talent pipelines of experienced talent (new hires) or those who recently graduated from college (university hires).
New Hire Representation
by Gender Identity

The representation of women in our new hire employee base decreased by 2% from 2023, bringing this metric to its lowest measurement since reporting began.
New Hire Representation
by Race & Ethnicity

BILAP representation across our new hire population decreased by 7% from 2023, with the largest decrease occurring across our Black and African American representation (38%). Latine/Hispanic representation across our new hire groups remains constant at 15%.
University Hires
by Gender Identity

Representation of women among our university hires has decreased 13% YoY.
University Hires
by Race and Ethnicity

BILAP representation among university hires has remained stable over recent years. While Black/African American representation is still lower than in previous years, representation across our Latine/Hispanic population has increased by 38% since 2021 - which can be attributed to the Puerto Rico leg of our LAUNCH program, which provides a cohort-style career onramp for upcoming and recent graduates.

Attrition Rate
Attrition rate across our BILAP population has decreased steadily over the last year - dropping nearly 8% since its two-year high in 2023 - and now holds one of the lowest attrition rates org-wide.
Opportunity
As we shared previously, we’re evolving our prior verbiage (equity) to match our updated focus on opportunity – creating and supporting pathways for success, regardless of background or circumstances.
Our approach ecompasses four focus areas: how we assess, develop, and support our talent, and how we support external efforts to build more diversified talent pipelines - enabling us to drive impacts closer to the root of the problem.

Accountability
Throughout our talent management process, we’ve integrated two key processes to help keep our performance analysis and progression equitable across teams and locations.

Disparate Impact Analysis
After employee feedback has been collected, our Central Talent team runs an analysis to look at broader performance, promotion, and compensation trends across business units and their employee demographics. This feedback is shared with talent leaders and business leaders across the organization to help ensure all talent is being rewarded fairly and without bias towards a particular demographic.

Employee Bias Training
Bias prevention is woven into our org-wide performance review training, and helps equip employees to provide fair and unbiased feedback when considering the behaviors and contributions of their teammates.
Development
This summer, we introduced our new “Great People to Work With” training, which sets the foundation for our behavioral expectations, teaches key conflict resolution skills, and equips teammates to respond to workplace and macro challenges with greater empathy, respect, and thoughtfulness.
The training has been integrated into our new hire onboarding program and was offered to all current employees in June 2024, achieving 98% org-wide completion rate within two weeks.
The addition of this training to our learning library, along with ≤ð¡Ò…Á«¯ employees‚Äô high participation ratio, reflects our continued investment in cultivating an environment where everyone is empowered to do their best work - and where employees actively seek out opportunities to improve.
Beyond org-wide training, we have also continued to invest heavily in providing learning and mentorship opportunities at multiple career stages - and we’ve seen promising diversity metrics across numerous development programs already this year.

Early Career
First launched this Spring, more than 200 ≤ð¡Ò…Á«¯ers have already enrolled in our Analytics Accelerator - a multifaceted development program aimed at upskilling associates in data utilization and analysis, led jointly with Data Camp. Program representation has achieved a near perfect balance between men and women, and BILAP representation has encompassed more than a third of all participants.

Management
First-time managers of all levels are flagged to complete our Managers and Leadership Essentials Program (MLEP), which equips them with the skills necessary to coach and develop their new talent. This year, women represent more than half of all course participants.
Leadership
Over the last year, 20% of ≤ð¡Ò…Á«¯ Directors have enrolled in our Leading Teams program which provides additional training for ‚Äúleaders of leaders‚Äù - and of these participants, more than half are women.

Support
In 2024, we continued providing a range of inclusive benefits - including gender transformation coverage and fertility care - and achieved a 100% score on the HRC Corporate Equality Index for outstanding efforts in promoting LGBTQ+ equality in the workplace.
About the HRC Corporate Equality Index
The Human Rights Campaign (HRC) is the nation’s largest LGBTQ+ civil rights organization, striving to make equality, equity, and liberation a reality for all LGBTQ+ people. Their is a benchmarking tool used to analyze corporate policies, practices, and benefits pertinent to LGBTQ+ employees, and to drive greater workplace inclusion.
Based on criteria including workplace protections, internal training and culture, inclusive benefits, and more, the HRC awarded ≤ð¡Ò…Á«¯ a perfect CEI score of 100%. We are proud to receive this accolade and to be listed among esteemed companies like Google, Walt Disney, Microsoft, and Amazon, and we look forward to continuing to find new ways to build a safe and affirming environment for employees of all gender identities.
Support (cont’d)
Additionally, this year, thanks to the advocacy and input of a small group of ≤ð¡Ò…Á«¯ senior women leaders, we greatly improved our resources around parental leave:

Pay Transparency
We created a resource to solve for pay transparency for expecting and new parents, helping employees understand how they will be paid during parental leave.

Performance Management Equity
We also created resources to support performance management equity, including how to assess performance equitably when planning for and/or returning from parental leave.

Expecting Parents’ Checklist
We consolidated existing resources into a comprehensive checklist for expecting parents, including steps to take before going on leave, how to prepare for coming back, and when to complete certain actions like adding your baby to your insurance.
In addition to our generous parental leave policies, these resources promote a more equitable experience for parents and have led to meaningful discussions on a global level, including a “working parents panel” featuring our CFO and senior leaders, about how teammates can best support working parents.

Community Impact: Road to Hire
≤ð¡Ò…Á«¯ is proud to be the founding corporate partner of Road to Hire - a 501(c)3 created by ≤ð¡Ò…Á«¯ CEO Ric Elias - which strives to interrupt cycles of intergenerational poverty and create pathways to high-growth careers for students from low-income backgrounds.
In addition to our broader corporate support, ≤ð¡Ò…Á«¯ employees also go above and beyond to donate their individual time and skills in service of the Road to Hire mission. In 2023, more than 100 employees volunteered to help mentor and train Road to Hire students and apprentices - providing personal guidance and expertise along participants‚Äô paths to opportunistic careers.
Conclusion
After four years of gathering, analyzing, and reporting on our DEI progress, we are steadily strengthening our ability to examine historical trend lines and build more robust diversity insights.
The better we can understand where we’ve come from, the better equipped we are to assess our opportunities and determine an improved path forward.
OVER THE NEXT YEAR
We look forward to the continued rollout of our People Health Scorecard and exploring the advantages that it can offer our leadership in making informed talent decisions. This routine data collection and increased visibility better enables us to integrate DEI work directly into our normal business processes - keeping it core to how we operate.
The work of building inclusive workplaces - environments where professionals of all backgrounds can achieve their full career potential - is nonlinear, and requires steadfast patience and commitment, but it will always be important. As we’ve shared, our aspiration is not perfection, but to get better every day.
We look forward to further exploring our growth opportunities and continuing on this journey together.